Viewing and Handling a Report
Videos for this articleViewing and Handling a Report
Once a report has been built and it appears in the My Reports windows, press the View button to go to the Cube View window.
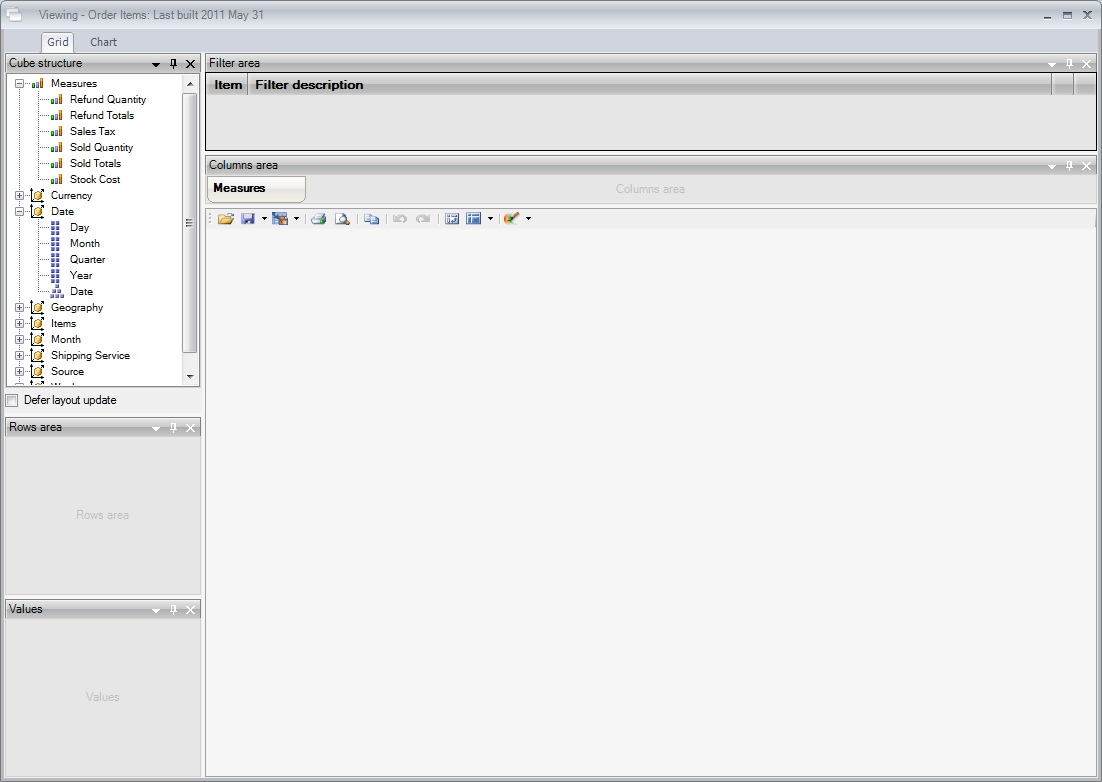
The Cube View window is split into six panes:
- Cube Structure – Displays a list of Measures and Dimensions, as defined when you built the report.
- Rows Area – The area where you can drag and drop Dimensions to be viewed as a row.
- Columns Area – The area where you can drag and drop Dimensions to be view as a column.
- Values – The area where you can drag and drop Measures
- Filter Area – Displays a list of filters that you have applied to the report.
- Report View – Displays the report that has been generated, as defined by the Measures and Dimensions you have selected.
To start building your report, simply start dragging and dropping measures and dimensions into the values and rows / columns areas. The Report View will then begin to populate with the results of your measures and dimensions. For example; to see the your sales totals for each individual channel by data simply place the Sold Totals measure into the Values area, the date dimension into the Rows area and the Source dimension into the Columns Area.
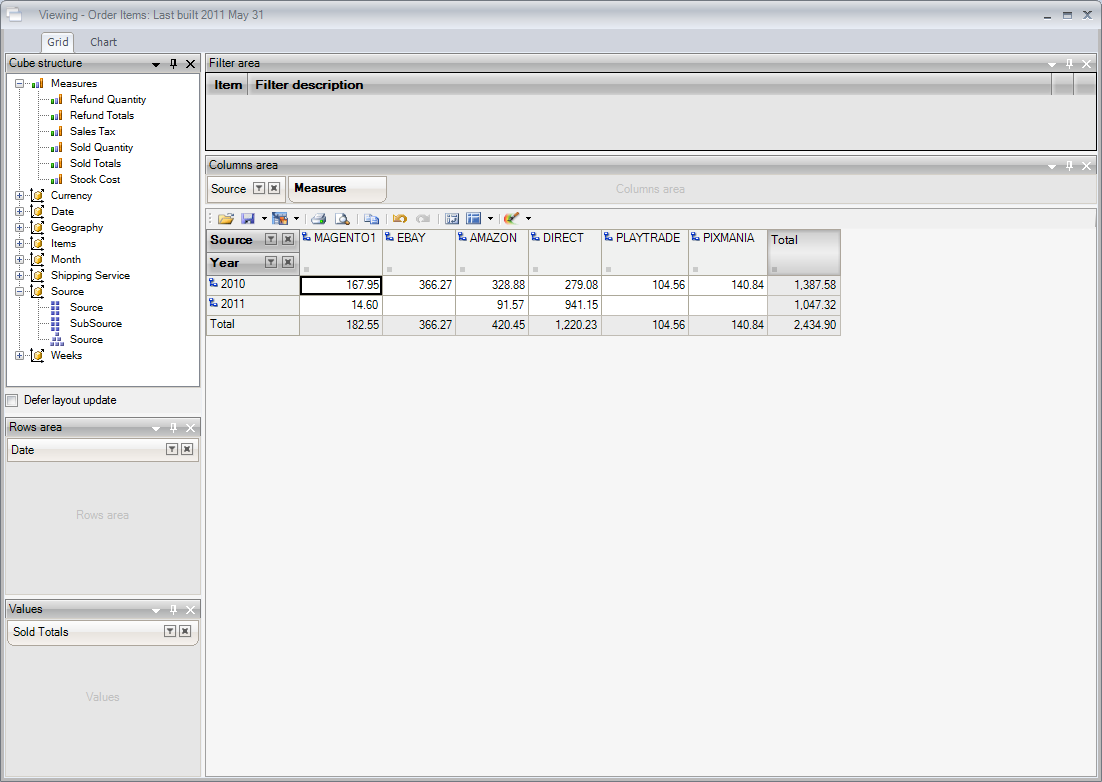
From the above screenshot you can see total sales by sales channel and by year. However, you can drill down further and view sales by quarters, months and even individual days. Do this by clicking the drill down button to the left of the dimension name:

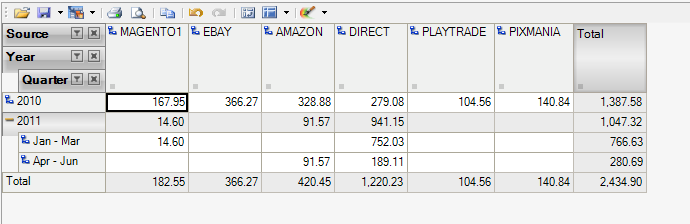

To drill back up a level of the hierarchy, click the ‘-‘ button to the left of the dimension name.
Filters
Filters allow you to sort through your data, allowing you to access more specific data. For example you can view sales by source by using the Sales Total measure and the Source dimension. However, you may want to view Sales from just Amazon, which is where a filter is useful. This can achieved by following these steps:
- Click the Edit button on the dimension you wish to filter to take you to the Hierarchy Editor window.
- Click the Filter button then Caption to take you to a list of available functions.
- Enter how you want to filter the data before clicking Ok to apply your filtering to the data.
- Your filter will then appear in the Filter Area at the top of the screen, where you can edit or remove it.

Calculated Measures
You can create a calculated measure inside the report that is a custom variable based on existing measures. This can useful for creating measures such as ‘Profit Margin’ which is Sold Totals minus the Stock Cost. To create a Calculated Measure follow these steps:
- Right-Click on Measures under the Cube Structure and select Create Calculated Measure.
- On the left side of this window you have a list of measures and dimensions that you can drag and drop into the Formula Editor. These can be combined with most standard mathematical operators to create the desired result.
- Once finished, name your Calculated Measure and click the OK button to save it.
- Your new named Calculated Measure will appear in the list of measures under the cube structure, where it can then be incorporated into your report.

Drilling Down and Drilling Up
Drilling down or Drilling up through data refers to navigating through the different hierarchical levels of a Dimension. Drilling up allows you to view summarised data, while Drilling down shows a more defined and detailed breakdown of the information. If you measure your sales across all channels against the time dimension, you would initially see sales by Sales Channel plotted against the year. Drilling down the time dimension allows you view sales over Quarters, Months and Weeks, giving you a detailed breakdown of how much you sold and when. You can drill down to investigate sales spikes, before drilling up to view a summary and see if the patterns are valid on a wider scale.
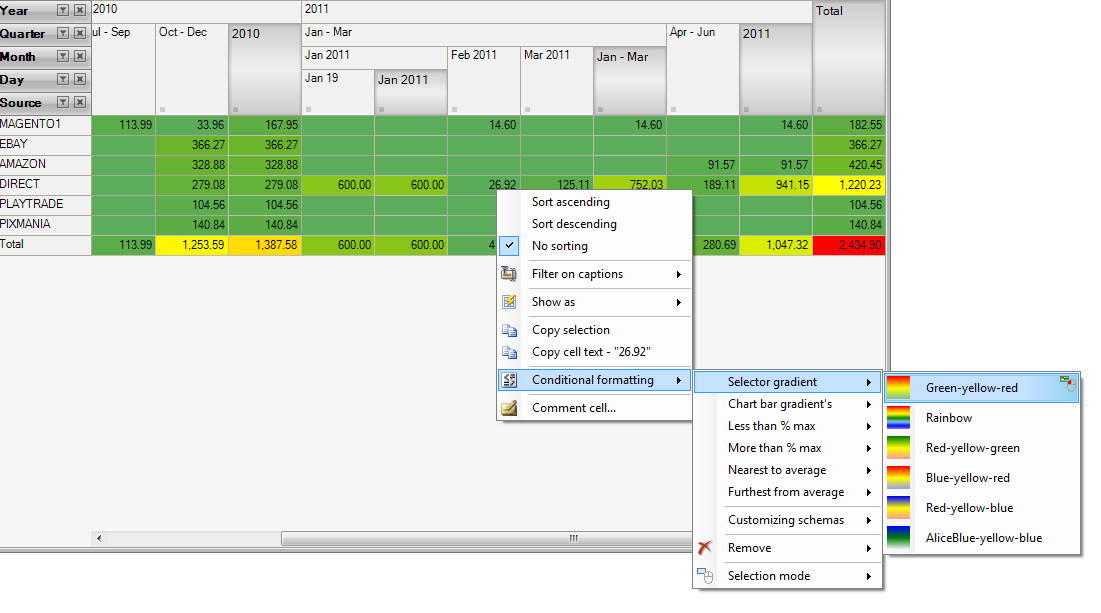
Conditional Formatting
Conditional Formatting allows you to apply colour and formatting to your measures, giving you an at-a-glance overview of your data. To apply conditional formatting simply select an area in the measures in the Report View, right-click and choose Conditional Formatting. You will be presented with a list of different formatting options that you can apply to the selection. Click on the formatting you wish to use to apply it. If you want to remove conditional formatting simply select the area again right-click, navigate to Conditional Formatting and choose Remove.
Videos and Files
Linnworks Analytics is a very powerful reporting tool that sits directly on top Linnworks database.Linnworks Analytics is based on OLAP (Online Analytical Processing) concept, therefore it is extremely flexible, functional, fast and capable of dealin...