Reporting - Inventory Dashboard
Inventory Dashboard
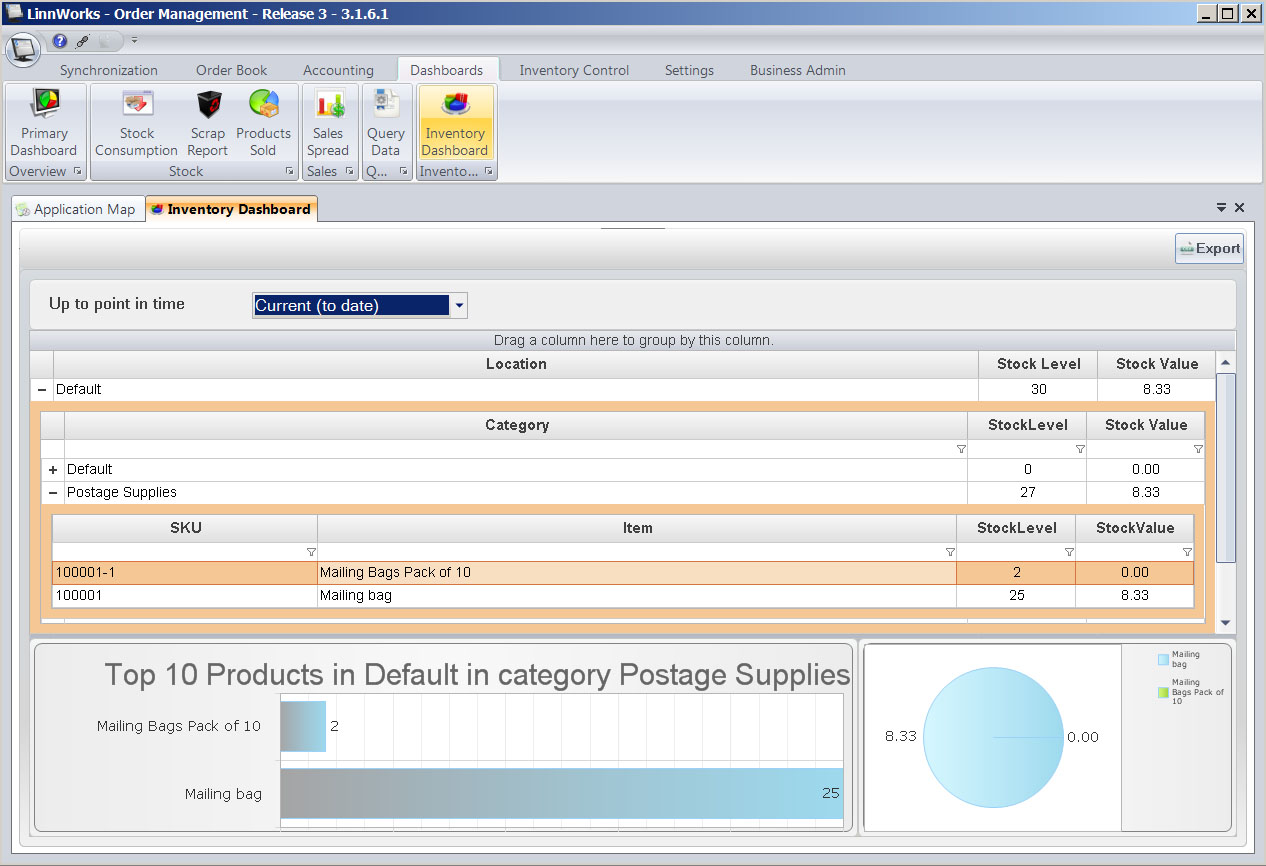
Inventory Dashboard is located in Dashboards > Inventory Dashboard. This reporting feature allows you to view your current stock level and total stock value as well as stock level and value at any past point in time.
Linnworks keeps track of all stock changes ever occurred in the system, therefore the history of stock values and level at any past point in time is available to view. To switch the timestamp, select the period from the drop down box Up to Point in time. To select a specific date - choose Custom item from the drop down and select the dates.
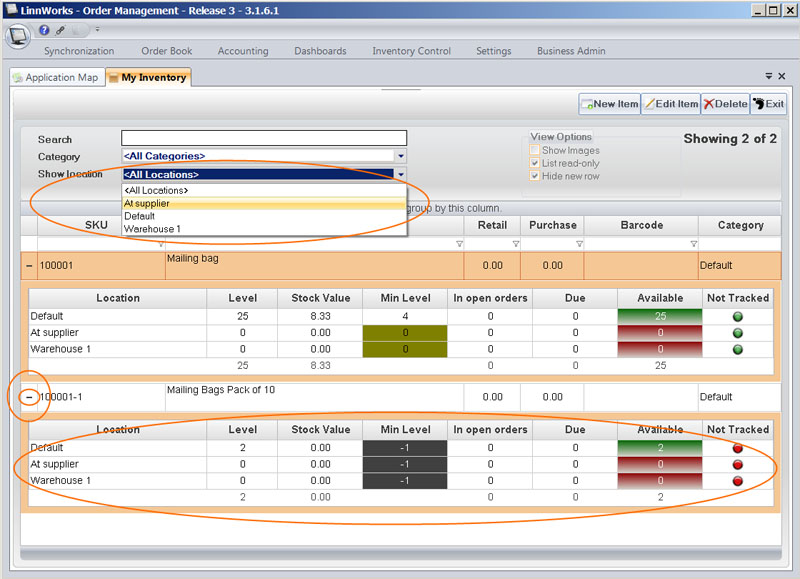
The grid is split into 3 levels:
- 1st level is the location (if you only have one location this will always be Default)
- 2nd level is product category
- 3rd level is the list of products
You can extract more detailed, time based report for each stock item by double clicking on the stock item record in the 3rd level sub grid. A new dashboard window will be shown for each individual stock item, which displays.
Consumption report - shows the changes in the stock level for the stock item and draws a timeline graph.
Sales Daily (90 Days) - shows aggregated sales for each day. The report shows total units sold each day, sold value, total value of stock sold at that time. (Total Sold Value � Total Sold StockValue gives you the true profit margin)

Sales Monthly - the same Sales Daily (90 Days) aggregated by month.

You can export the data into a CSV file by clicking Export button on the top of the screen.